Build vs buy site selection software: GIS and spreadsheets or a platform?
Last updated:
10 min read

For most multi-site occupiers expanding or reshaping a portfolio, the best answer is the third path: buy the portfolio record and a site selection agent, and keep your own weights, cost ceilings and committee format on top. The in-house version (GIS, licensed demographic data and an Excel model) answers the market question well. The portfolio question, how this site compares with the leases, occupancy costs and stores you already have, is where a shared record earns its keep.
Most real estate teams are not choosing between nothing and software. They already have a homegrown model. The question is how much more to invest in it, and which parts are worth owning.
What does "building" site selection actually look like?
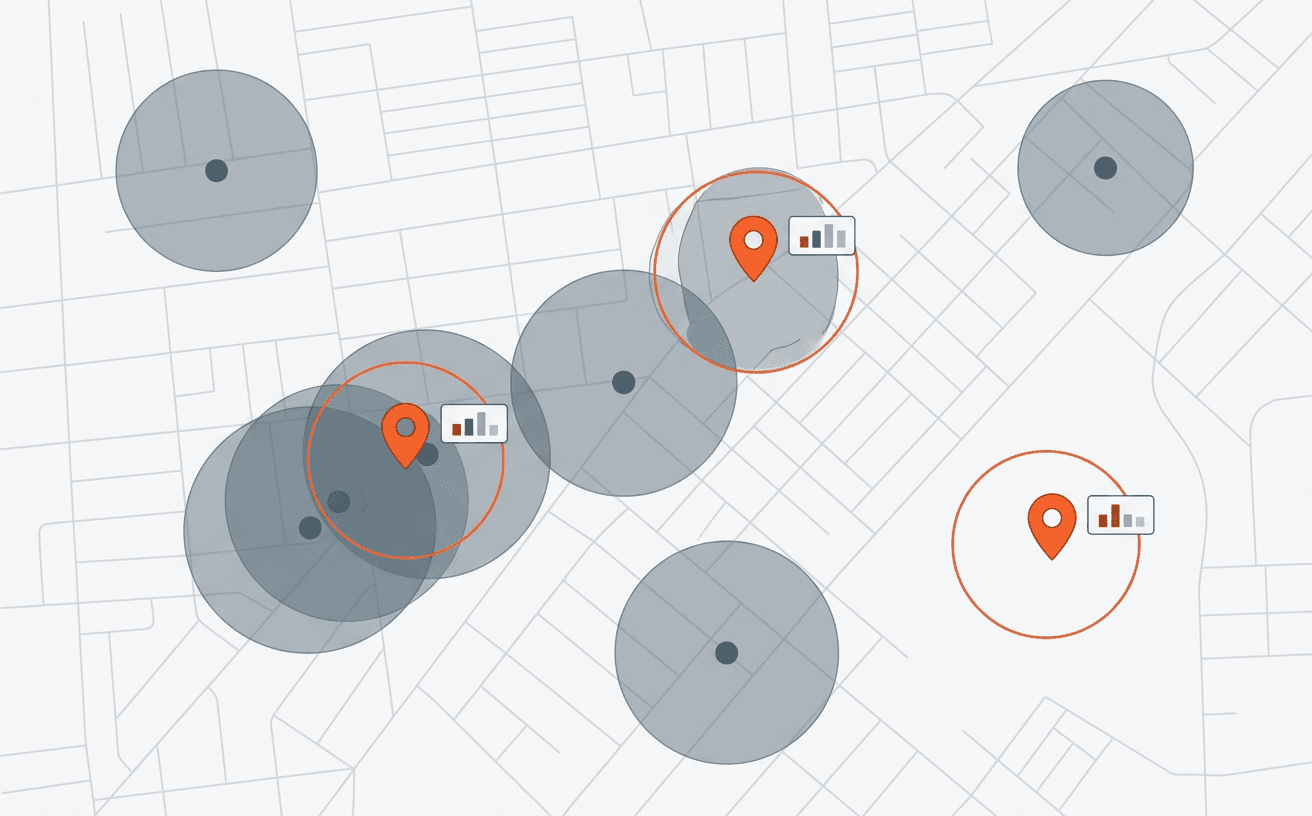
In-house site selection usually has three parts. A GIS tool draws trade areas and maps competitors. A licensed data feed supplies demographics, daytime population and traffic counts. An Excel workbook pulls those numbers together, applies weights, and produces a ranked list for the real estate committee. One analyst, sometimes two, owns all of it.
That setup is a reasonable one, and it is also a build that carries the costs of one. The weights live in cell formulas few people have audited. Trade areas get redrawn by hand for each deal. Existing-store performance and lease terms come from separate systems and get pasted in. When a candidate needs to be compared with the occupancy cost of the three nearest stores you already lease, the analyst opens lease abstracts one by one.
Here is what a team owns when it keeps the build:
| Component | What it involves | Who owns it |
|---|---|---|
| Trade area definition | Drive-time or radius polygons per format, redrawn per candidate | GIS analyst |
| Market data | Licensing, refreshing and reconciling demographic, traffic and competitor feeds | Analyst plus procurement |
| Existing portfolio data | Store performance, lease terms, occupancy cost per location, pulled from separate systems | Analyst, by hand |
| Scoring model | Criteria, weights, thresholds, usually in Excel | Analyst |
| Cannibalization check | Overlap between candidate and existing trade areas | Analyst |
| Comparable occupancy cost | Rent and pass-throughs at nearby owned or leased sites | Lease admin, on request |
| Committee package | Ranked list, maps, rationale, assumptions | Analyst |
| Version control and audit | Knowing which weights and data produced last quarter's decision | Often unassigned |
| Handoff to leasing | LOI terms and dates into the lease system after signing | Transaction manager |
Why does the build start to strain?
The in-house model strains because portfolio questions take far longer than market questions. Pulling demographics for a trade area takes minutes. Comparing a candidate with your own nearby leases, their occupancy cost, their expiration dates and their co-tenancy rights takes days, because that data sits in lease documents and finance systems the GIS never sees.
REAL has modeled this for a complex location-analysis workflow: roughly 40 hours of experienced specialist effort per location, against about 20 minutes of REAL analysis. REAL is explicit that this is a modeled figure, that manual-equivalent effort is not realized savings, and that it is not a price (REAL, Portfolio Strategy). Treat it as a sense of scale. Across 100 locations, the modeled gap is about 4,000 hours versus about 33.
The second strain is key-person risk. When the analyst who built the workbook moves on, the logic often goes too, and the next person rebuilds it rather than inheriting it.
Related reading: what site selection software does.
What does the in-house stack cost to run?
The in-house site selection stack costs more than its license line suggests, because most of the cost is people and refresh work rather than software. Price it by category, over the same horizon you would use for a subscription. Every input below is yours to fill in; prices vary too much by vendor and contract to quote here.
| Cost category | Formula | What teams forget |
|---|---|---|
| Market data licenses | Sum of annual fees for demographic, mobility or foot traffic, traffic count and competitor data | Renewal increases and per-market or per-seat limits |
| GIS software | Seats × annual cost per seat | Add-on modules for drive-time or routing |
| Analyst time on deals | Candidates evaluated per year × hours per candidate × loaded hourly rate | Time spent pulling lease and occupancy cost data by hand |
| Model upkeep | Hours per year to re-weight, re-test and document the scoring model × rate | Often skipped, which is how weights go stale |
| Data refresh | Refreshes per year × hours per refresh × rate | Reconciling new data vintages with old scores |
| Committee packages | Packages per year × hours per package × rate | Rebuilding maps and tables for each meeting |
| Key-person cover | Hiring and ramp time when the analyst moves on | The model often leaves with them |
Annual in-house cost = data licenses + GIS seats + (deal hours + upkeep hours + refresh hours + package hours) × loaded hourly rate. Compare that total with a subscription plus the internal time you would still spend reviewing scores and preparing for committee. If you already pay for the data and a full-time analyst, the question is less about cost and more about throughput and key-person risk.
When does building site selection make sense?
Keeping or building an in-house model is a reasonable choice in these situations:
- Low deal volume. A handful of openings or relocations a year rarely justifies a platform. A careful analyst with good data will do.
- A stable format and market. One store prototype in a region you know well means the scoring model rarely needs to change.
- A strong, long-tenured analyst. Someone who owns the model, documents it, and plans to stay.
- Market-only decisions. If the committee only needs demographics and competition, without a comparison to existing leases, the GIS stack covers it.
- A one-off study. A single market entry or a single consolidation exercise can be run as a project and archived.
Outside those cases, the model tends to become a bottleneck: deals wait on one person, and the committee sees a ranking without the reasoning behind it.
What is the third path?
The third path is to buy the portfolio record and the site selection agent, then run your own criteria and committee outputs on top. You keep control of the parts that reflect your strategy: format, weights, cost ceilings and the committee template. The vendor handles reading the leases, holding occupancy cost per location, and keeping scores reproducible.
Ask any vendor who builds those workflows. Some expect your team to build them on their platform, which brings part of the run cost back in house. With REAL, you define the rules and REAL's engineers build and maintain the workflow on the shared record.
REAL's site selection agent scores candidate markets against your criteria (format, trade area, demographics, competition, traffic, cost ceiling) and against the leases you already hold. The action it produces is a ranked shortlist a committee can approve. The evidence is attached: comparable occupancy cost, trade-area overlap with existing stores, and the weights and inputs behind every score. When a deal is signed, LOI terms and dates pass to lease administration without re-keying. Your own scoring logic or committee format runs as custom workflows on the same record.
Build, buy, or buy and build on top: a decision scorecard
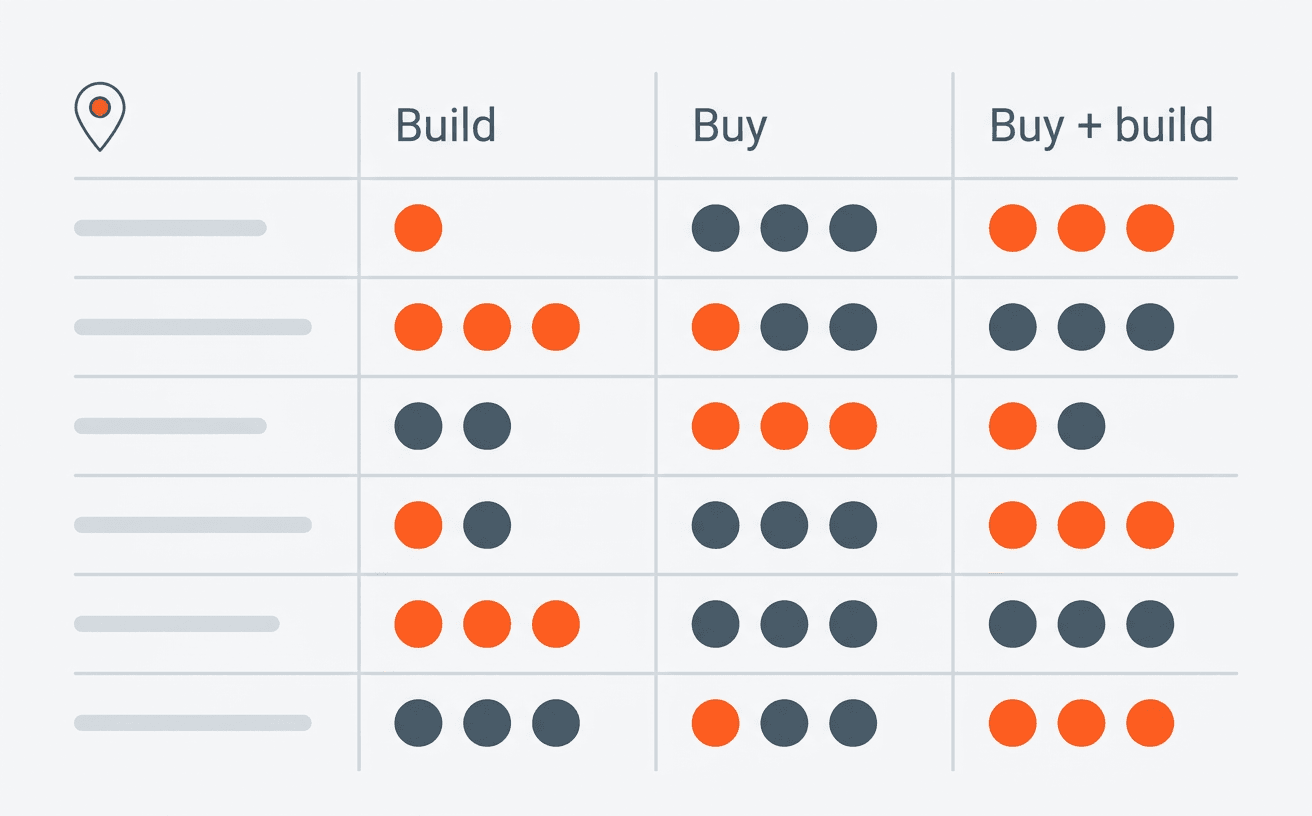
| Criterion | Keep or build in-house | Buy | Buy + build on top |
|---|---|---|---|
| Market and demographic analysis | Strong with licensed data | Strong | Strong |
| Comparison with your own leases and occupancy cost | Manual, slow | Depends on whether the vendor holds your lease record | Included |
| Transparency of weights | In formulas, rarely reviewed | Vendor shows inputs, if designed to | Your weights, visible |
| Reproducibility of past decisions | Depends on documentation | Vendor | Vendor |
| Key-person risk | High | Low | Low |
| Fit for unusual formats | Strong | Varies | Strong |
| Throughput at high deal volume | Limited by analyst hours | High | High |
| Who builds your custom logic | Your team | Limited to configuration | With REAL, REAL's engineers, to your rules |
How do you test site selection software on your own stores?
Test site selection software, or your own model, on stores whose results you already know. A test on your own history tells you far more than a demo on a market you have never entered.
- Give the tool your history. Share store performance, formats and the leases behind each location, so the scores reflect how your stores actually perform.
- Hold back a set of stores. Keep 10 to 20 recent openings out of what the tool sees. Ask it to score those sites as if they were candidates.
- Compare its ranking with what happened. Check whether the stores it ranked highest actually performed best. A model that sorts your own recent openings well is one you can use for your next ones.
- Read the reasoning on a live candidate. Pick one site your team is weighing now. Ask the tool to show the inputs, weights and comparable occupancy cost behind its score. If the committee can follow the reasoning, the score will hold up in the meeting.
- Check the portfolio questions. Ask how the candidate compares with your three nearest stores on rent, pass-throughs, lease term and trade-area overlap. This is where a shared lease record makes the biggest difference.
- Agree measures of success up front. Ranking accuracy on held-back stores, time to a committee-ready package, and whether every score can be explained.
Run the same test on your current in-house model. It is the fairest comparison you can make, and sometimes it shows the existing model is better than people thought.
Questions to ask before you decide
- How many sites will we evaluate in the next two years, including closures and relocations?
- Can we compare a candidate's occupancy cost with our three nearest stores today, and how long does it take?
- Who can explain the current weights, and are they written down anywhere?
- Can we reproduce the ranking the committee approved last year?
- Does a consolidation question use the same model as an expansion question? See when to consolidate a location.
- Who builds and maintains our custom scoring logic, and what happens to it if that person moves on?
For how the same decision plays out across lease administration, accounting, construction and facilities, see build vs buy AI agents for corporate real estate. For the space side of the portfolio, see build vs buy space management software. To price the in-house version, use the cost model for building AI for real estate operations.
The third path keeps your strategy in your hands and puts the lease reading, occupancy cost and reproducible scoring on a foundation someone else maintains.
FAQ
What does site selection software do that GIS does not?
- GIS maps trade areas, competitors and demographics. Site selection software adds scoring against your criteria, a comparison with your existing stores and leases, and a reproducible record of why a candidate ranked where it did. The difference shows up when the committee asks how a site compares with the locations you already pay for.
Is Excel good enough for retail site selection?
- For a few deals a year in a stable format, often yes. Excel gets harder to rely on as deal volume rises, as weights need to change by format or region, and when the person who built the workbook moves on. The risk is less about calculation errors and more about logic nobody else can explain.
How does site selection software handle cannibalization?
- It measures overlap between a candidate's trade area and the trade areas of existing stores, usually as a share of households or visits. Good tools show the overlap per nearby store, so the team can see which location loses traffic and decide whether the net gain still justifies the opening.
How do you know if a site selection model is accurate?
- Backtest it. Hold back stores the model has not seen, ask it to score them, and compare its ranking with how those stores actually performed. Repeat with each new vintage of data. A model that ranks your own recent openings in roughly the right order is one you can use for your next ones.
How many stores do you need before a sales forecast model is useful?
- It depends on how similar your stores are. A chain with one format and consistent markets can learn from fewer stores than a company with many formats and regions. With a small portfolio, rules-based scoring and close analogs to existing stores are usually more reliable than a statistical forecast.
What data does site selection software use?
- Most tools combine demographics, daytime population, mobility or foot traffic data, traffic counts and competitor locations. The stronger setups add your own data: store sales, formats, lease terms and occupancy cost per location. Your own data is what makes a score specific to your portfolio.
Should site selection be connected to lease administration?
- Yes. Lease terms decide much of a site's real cost and flexibility: rent, pass-throughs, term, renewal options, co-tenancy and exclusives. Connecting the two means candidates are priced against real comparable occupancy cost, and signed LOI terms flow into lease administration instead of being re-keyed.
More From Our Blog
More
Knowing when to consolidate a location
Reading portfolio performance in real time so the call to invest, hold, or exit is grounded in evidence.

What is space management software, and how does it connect to occupancy cost
Booking a room and measuring how it is actually used are two different questions. Neither means anything for a portfolio decision until it is tied to cost.

What is site selection software, and why one-time studies are losing ground
A market that looks open on paper often is not. Site selection software scores candidate locations continuously instead of once, before a lease gets signed.

Initial agents live in two weeks.
Start with one or two high-value workflows, connect the required data and documents, measure the result, then expand across domains.
- A tailored onboarding for every enterprise.
- Fitted to how you actually work.
- Continuous support as your portfolio evolves.